Running a Model and Reading Results
What you'll need
- A saved model configuration
- All selected data sources in Connected status
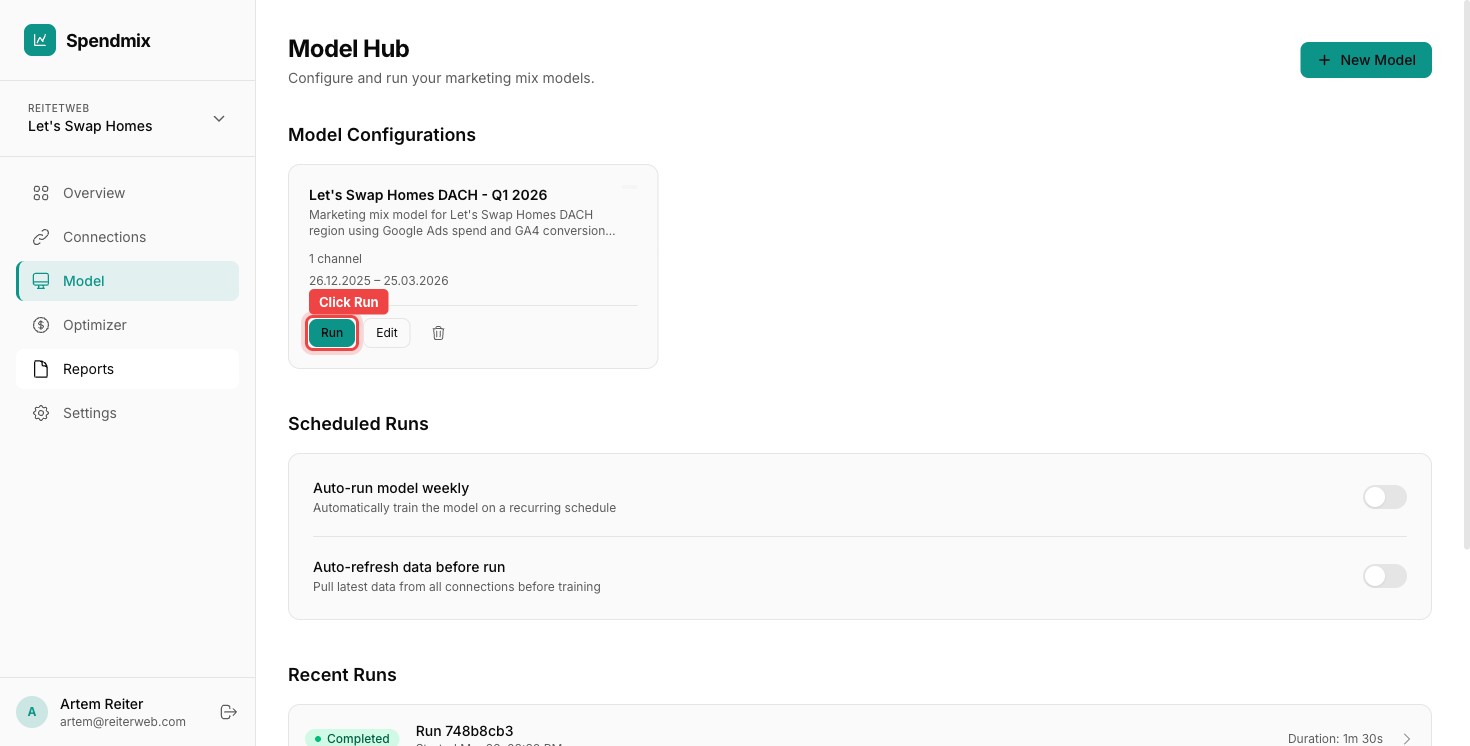
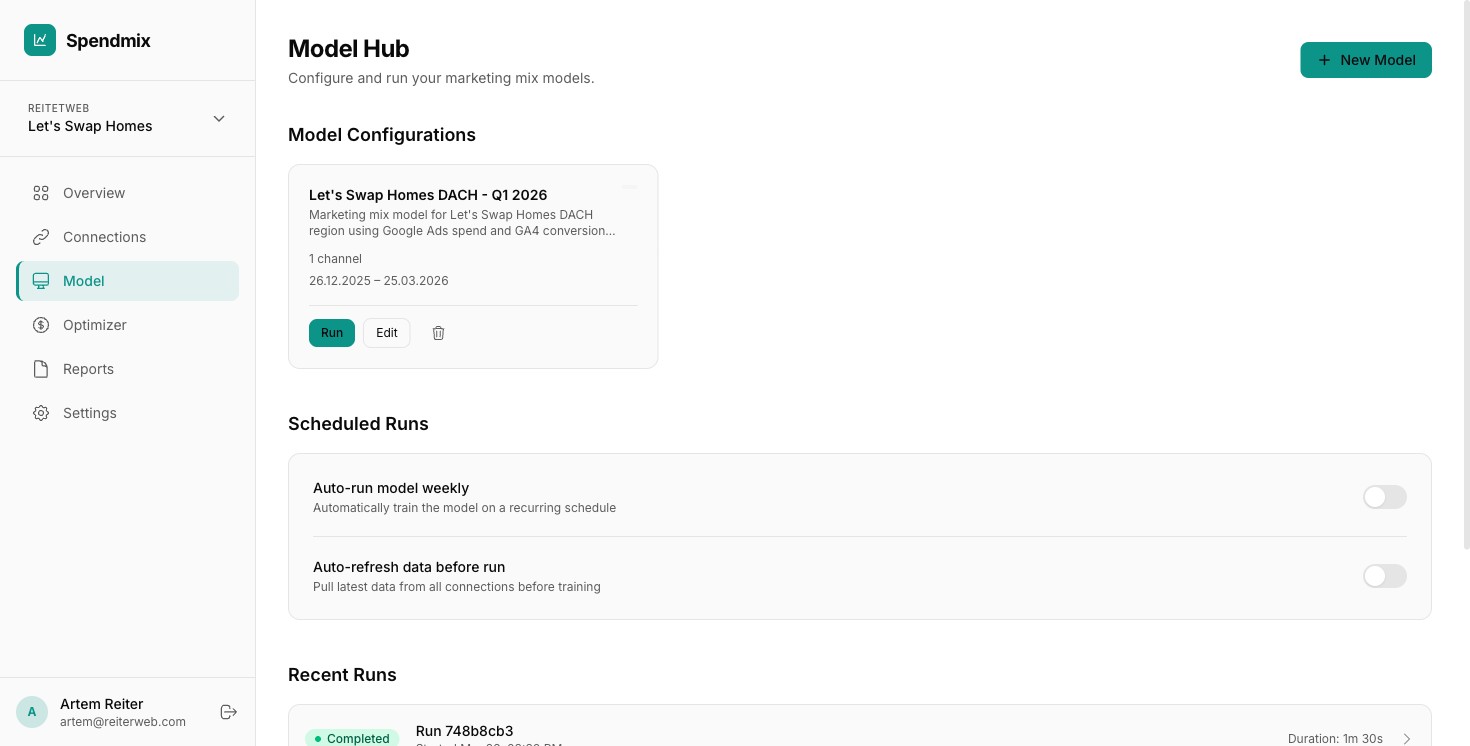
Start the run
On the Model Hub page, find your configuration and click Run. The model enters the processing queue.
Watch the progress
The run page shows real-time progress through four stages: Data Preparation, Sampling, Analysis, and Saving. You can close this tab and come back later.
Open the results
When the run completes, click it to open the results page.
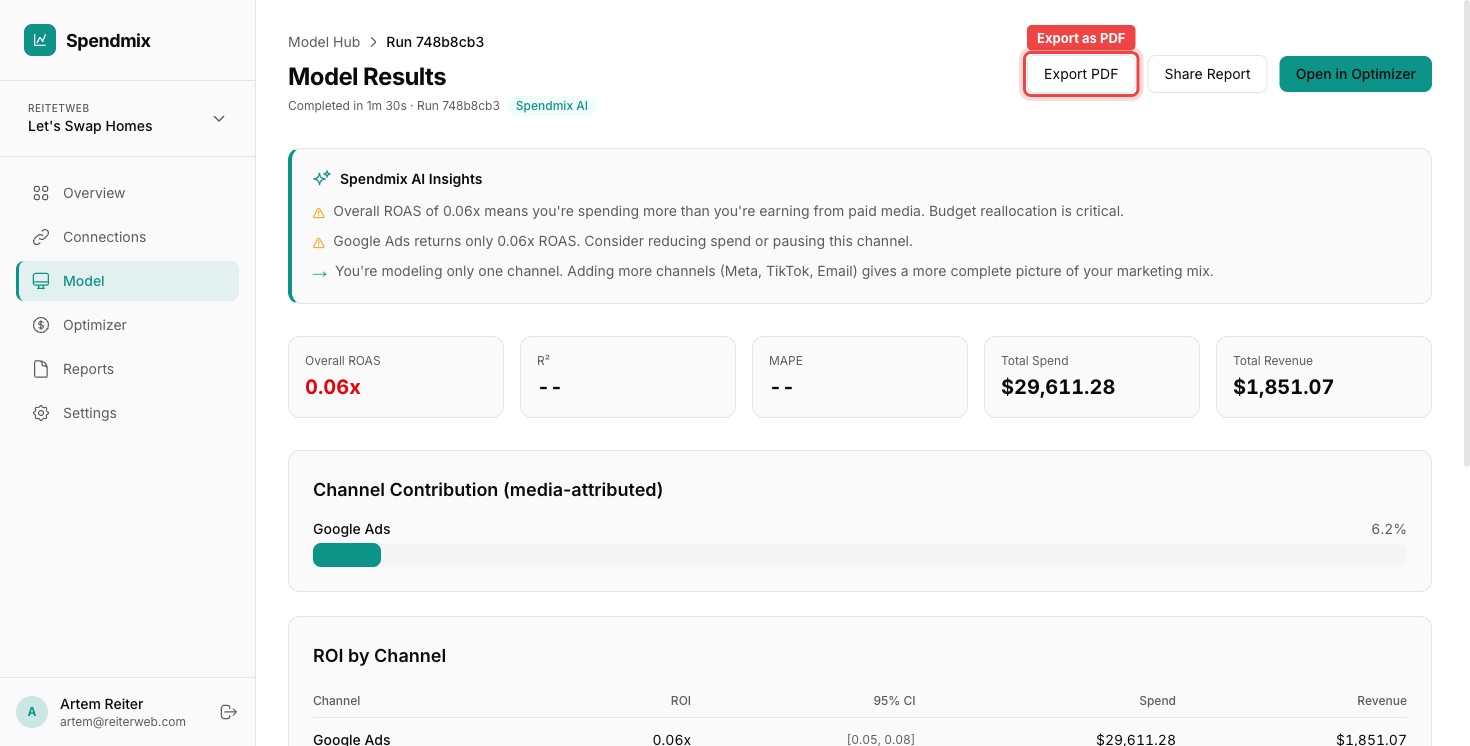
Read the AI Insights
At the top, you will see AI-generated insights summarizing the key findings. These give you actionable recommendations in plain language.
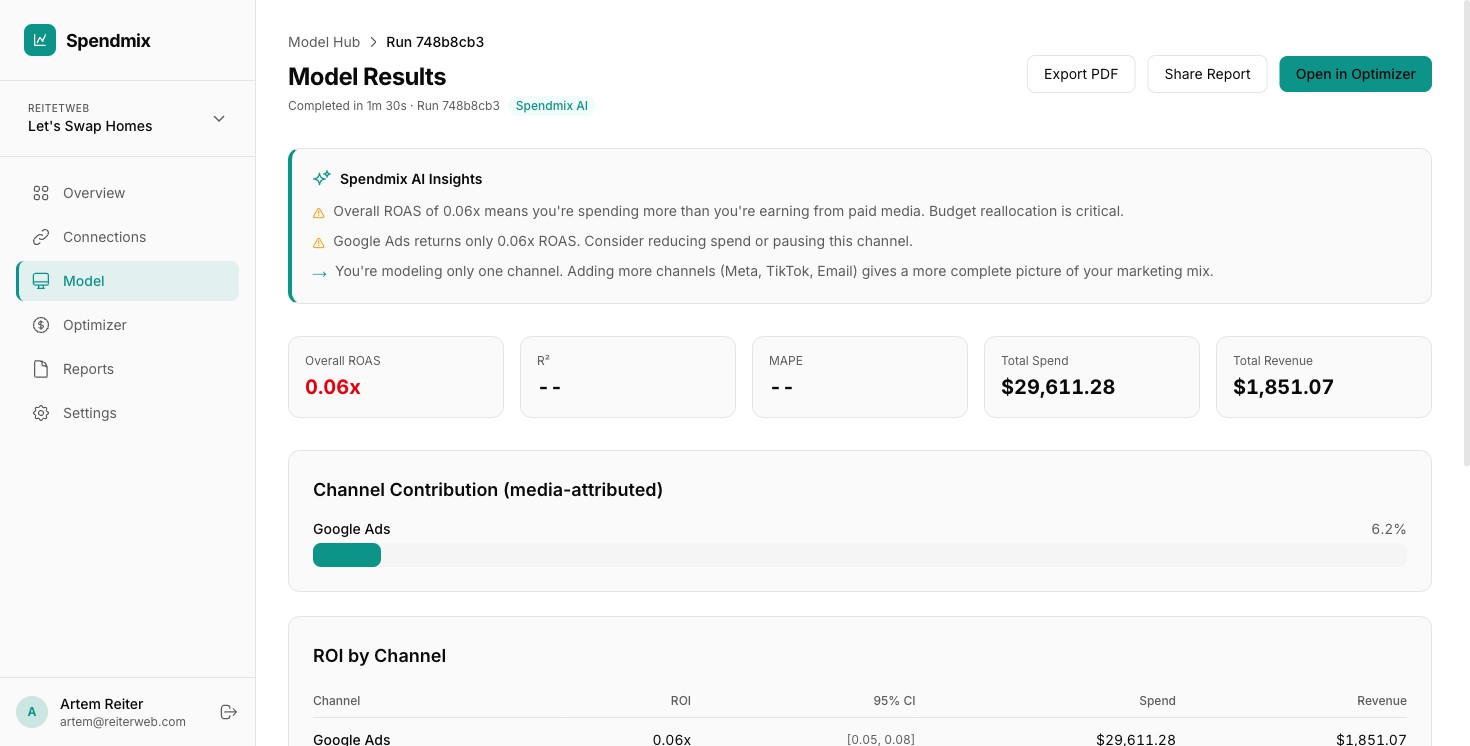
Review the KPI cards
The summary cards show Overall ROAS, R-squared (model fit), MAPE (error rate), Total Spend, and Total Revenue. An R-squared above 0.85 indicates a strong model.
Analyze Channel Contribution
The Channel Contribution chart shows which channels drive the most value. Larger segments mean higher contribution to your KPI.
Check the ROI by Channel table
Each channel has an ROI estimate with a 95% confidence interval. Green (ROAS above 1.0) means the channel is profitable. Amber (0.5–1.0) means it is marginal. Red (below 0.5) means it is underperforming.
Decide on next steps
If channels are underperforming, consider reducing their budget or testing new creatives. Use the Budget Optimizer to model reallocation scenarios before making changes.
Next step